The Greyhound Tracking System automatically tracked 6 dogs, and the mechanical hare. It also automatically detected race launches by detecting the opening of the cage. These coordinates were streamed across the Internet in real time in order to allow pundits to view racing on PCs.
Between December 2003 and April 2004 I built a live tracking system for tracking greyhound (dog) racing in Swindon. The system used 52 low grade video cameras evenly distributed around the track, and these required up to nine Pentium 4 class computers in two cabinets for computing power (you can imagine me looking like a bit of a mad scientist with all this computing gear at the race course). To my knowledge, this is the first ever sport tracking system which tracked all participants in real time and streamed the data over the Internet directly to end users.
Key lessons of this project:
- Simplification of the problem is key – in this case I found it computationally advantageous to re-project the race course into a straight line (and perform necessary physics & predictions in this simplified space).
- Certain materials are near-invisible to low end cameras equipped with IR sensors.
- Keep your tracking cameras away from floodlights and other light sources, as these will attract moths at night.
Just like with the old Speedway system I had built a year prior, these days one could recreate a system like this for a fraction of the cost.
Specification:
- Nine Pentium 4 class computers
- 52 QPAL camera feeds in CCTV enclosures
- Automatic tracking of 6 dogs and 1 mechanical hare
- Automatic identification of race launches
The Greyhound Tracking System in Pictures – Clickable Gallery
 As with the previous real-world tracking system prototype at the speedway stadium, a cherry picker was required for initial setup and calibration
 For safety reasons the camera scaffolding was reinforced with cross diagonal bracing
 Closeup of one of the sensors. The majority of tracking cameras were inexpensive off-the-shelf CCTV cameras with PAL output
 Groups of cameras were powered through centralised junction boxes which also housed the PAL transmitters.
 Once a camera group had been confirmed operational the wiring was buried. Here is a picture of an exposed wiring run before final installation.
 Although the majority of racing was at night, during the daytime the "Carlsson Colonnade" was aesthetically noticeable.
 Inside the stadium the tracking system was physically quite big. Two separate racks of computers and an operator's desk. Note the black camera wiring run in the ceiling.
 Another angle of the indoor tracking system setup. The system was in operation and streamed live racing data for a year, and all the tracking computation was done locally.
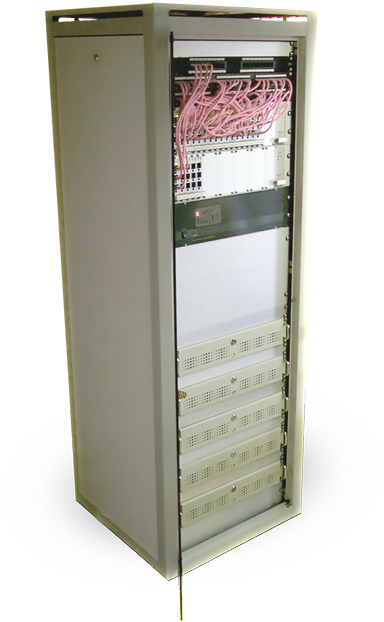
 Close-up of the video signal ingest. Video matrix unit at the bottom (black). The programmatically controllable matrix took 64 inputs and provided 16 outputs, meaning that not all video signals had to be active at the same time.
 The camera power was on a timer, allowing for the cameras to warm up ahead of the event. Powering up cameras a couple hours beforehand avoided condensation-related problems.
 A closeup of the other rack. At the top there was a KVM switch for accessing multiple computers with a single monitor and keyboard, the taller 4U rack PCs were for centralised data processing and monitoring, and the thinner 2U units were for signal ingest and computer vision processing (capable of handling two video feeds each). Network switch at the bottom.
 Just a general shot of dogs approaching the home straight at Swindon Stadium, in case you have not seen what British greyhound racing looks like. These dogs are impressively quick!
The Business Case and Outcome
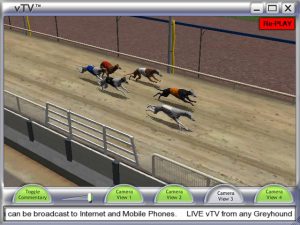
The raison d’être for the project was to enable the viewing of live sports events over the slow dialup connections which had been the norm for households in Britain at the time. With the aid of this technology the races were recreated virtually using a PC application which represented the race tracking data in 3D (see clickable screen shot on the right, or the video in Fig 3 further up). The monetisation would come from bookies taking bets on live racing results.
Ultimately the cost of equipping more stadiums with such systems (£50K per stadium) turned out to be too high relative to the likely return on investment. Domestic broadband was also becoming more obtainable with BT rapidly upgrading exchanges. As such, no additional systems were ever built.
All was not lost, however. As household broadband penetration increased in the UK I eventually ended up hosting the biggest CDN for British greyhound video streaming for many years to come (thanks to the contacts and relationships established during this pioneering project). That, however, is a story of its own!
The System Technical Details
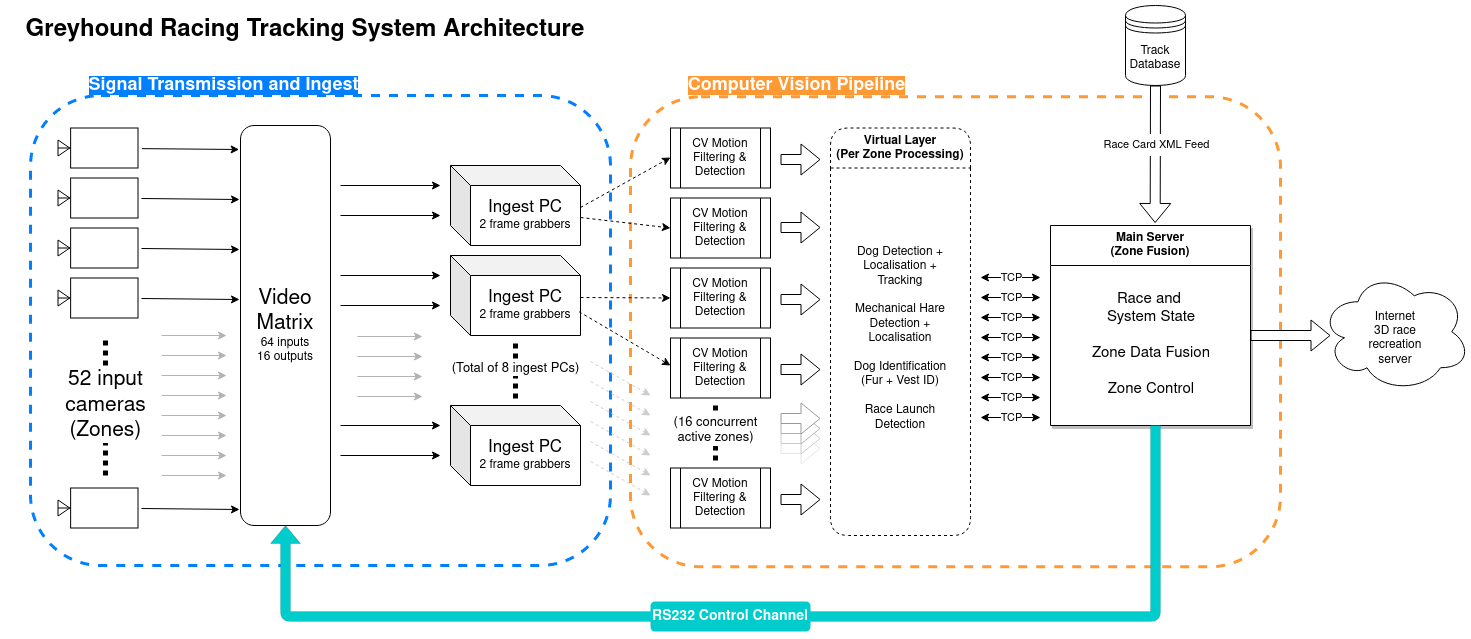
The overall system architecture can be seen in the above diagram (Fig 4). The 52 input sensors (covering 52 “Zones”) were fed through a controllable Video Matrix which delivered 16 live feeds as output. These were processed across 8 ingest PCs equipped with two analog video frame grabbers each. The video frame grabbers turned the analog video signal into bitmaps in PC memory. Each (at this point) digitised feed was subsequently processed using basic computer vision algorithms to filter out any interesting movement, and these regions of interest were then processed with more complex high level algorithms (processing dogs, mechanical hare, and starting gate). All this generated interim “front-end” data was then ingested by a Main Server process which generated the final 3D “back-end” outputs by fusing data from the 52 individual zones.
Admittedly the design was simple, but keep in mind that this was developed in 2004 when much of the capability was limited by hardware, and there were few if any off-the-shelf modules available for solving the computational problems. In essence, I was forced to custom-build all of the software and algorithms.
In the clickable gallery below you can see a bit more of my ‘programmer’s view’ of the project’s development stages:
 Each camera lens was focused by hand, making it necessary to calibrate the sensor after it had been mounted. This meant capturing up to 10 calibration chart images per sensor while standing on a cherry picker (before moving on to the next camera - and then you only had 51 more cameras to go!). Luckily this process only needed to be done once per camera install. I designed and developed the calibration process from scratch (this was after all 2004, long before libraries like OpenCV reached maturity).
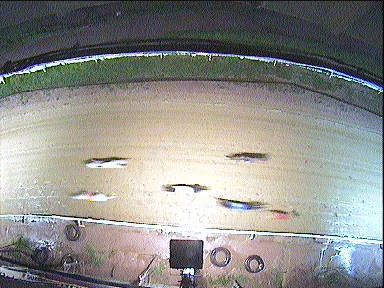
 In early prototyping a chessboard pattern was moved past the camera zones in order to confirm the effective zone coverage and estimate the pixel densities for dog identification. The dark areas in the upper corners of the image are from the weatherproof camera enclosure.
 More early prototyping imagery - in an early stage I ran a system covering only a few camera zones closest to the finish line. The PAL transmitter receiver can be seen at the top, feeding analog PAL into regular P4 desktops (fitted with two frame grabbers per ingest PC). This scaled down version enabled key subsystems to be proven out before scaling the system to cover the full track.
 Accidental selfie captured in the "server room" by one of the tracking sensors. This image captures the relatively ascetic work environment. As I was sitting directly below an uninsulated tile roof the temperatures were often on the chilly side. On the other hand the locals were always friendly and helpful, so a hot drink to keep warm was never too far away!
 Debugging dog and vest identification algorithms. The first pass CV motion detector's regions of interest are displayed as red dotted squares. Each detected dog had three main identification areas extracted for processing (the yellow rectangles), namely the front, the vest area, and the rear.
 Dog identification was done using a rudimentary machine learning system which was basically a database of various overhead dog images, from which salient features were automatically extracted for real time matching. The advantage of this approach was that it was non-invasive, i.e. the dogs did not have to wear anything out of the ordinary to be trackable.
 Example of a tracking sensor image on a good day. This shot demonstrates how the inexpensive PAL cameras were prone to colour distortions, such as the red vest appearing purple in this image. On a few of the cheapest IR capable sensors the black vests were often near-invisible!
 Zone fusion debugging display - here I am examining an early problem where the red 1 and orange 5 dogs were mixed up between two adjacent camera zones. This was easily solved by delegating the zone fusion to be responsible for all high level identifications, and thereby relegating the zone-specific processing to just cover the computationally more intensive intermediate confidence estimation. (NB: Target 0 peeking at the very bottom was the mechanical hare!)
 Example of the diversity of illumination conditions encountered by the sensors. The finish line had bright spotlights for a photo-finish camera used by the track. This caused an (admittedly important!) part of the track to be overexposed in the night races.
 Example of interlacing in the raw unprocessed digital PAL image. For this particular system the mitigation was easy - I simply ignored every other scan line in the processing! In practice the very limited compute budget of the P4s forced this trade-off, as all computations (for two live ingest signals per PC) had to be done on the CPU.
 Another example of an early problem I had - debugging the real time video encoder/decoder. For performance reasons I had developed a custom video compression algorithm. Initially it did not work well in sunlit conditions whenever dog shadows occupied too many macroblocks, and so I had to tune the processor to deprioritise shadow regions.
 Identification failure database samples. The system automatically stored snapshots of dogs which the high level zone data fusion determined to have been misidentified (or not identified sufficiently well) by the zone-specific processing algorithms. In the early development stage there were quite a lot of these cases, but systematic labeling of such datasets (for inclusion in the "data lake") made the system robust to diverse tracking conditions and sensors.